Multibeam Coverage % & Density
Guida all'Applicazione / Application Guide
Come Funziona
Vai alla APPQuesta applicazione web analizza i file di testo XYZ provenienti da rilievi multibeam (MBES) in formato RAW per visualizzare la pecentuale di copertura e calcolare la densità dei dati. Utile anche per la verifica di rilievi certificati.
Guida Rapida
- Caricamento Dati:
- Seleziona un livello di Decimazione Dati (es. "1 punto ogni 200"). Un valore più alto è più veloce ma meno dettagliato.
- Clicca su "Choose Folder" e seleziona la cartella
contenente i tuoi file
.txt. I file devono essere formattati comeE,N,Z(Est, Nord, Quota). - Clicca "Analyze Data" per avviare l'elaborazione.
- Analisi dell'Area (Opzionale):
Per calcolare statistiche su un'area specifica, hai due opzioni (usa solo una alla volta):
- File DXF: Clicca "Choose DXF File" per caricare un poligono, ad esempio i limiti del porto, entro il quale fare i calcoli.
- Disegno: Clicca "Draw Rectangle" e disegna un rettangolo direttamente sulla mappa.
- Visualizzazione e Statistiche:
- La prima mappa mostra la percentuale di copertura (overlap).
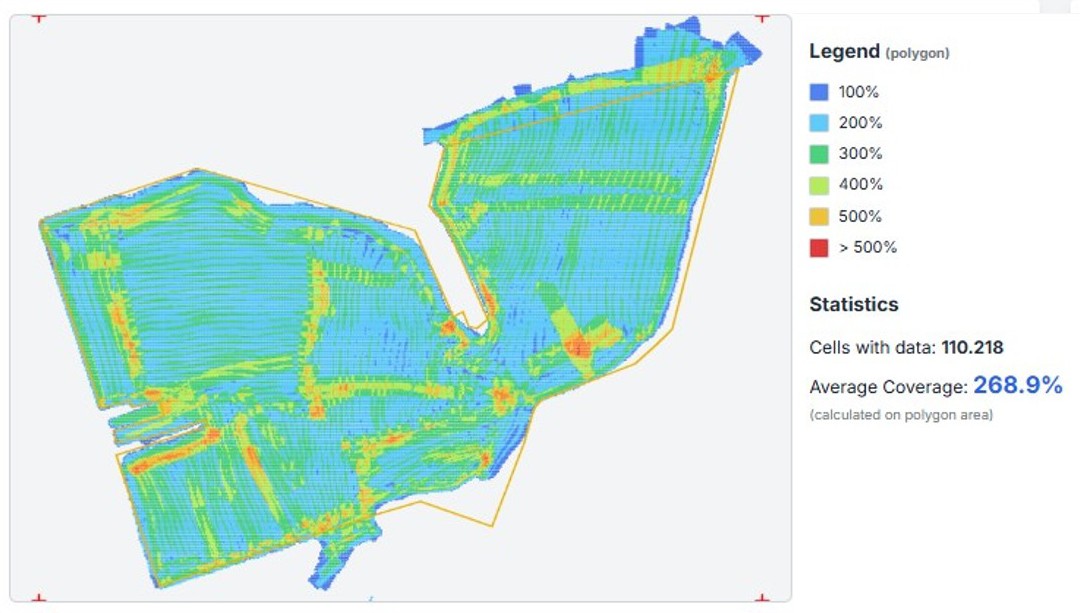
- La Legenda mostra i colori corrispondenti alla percentuale di copertura calcolata solo nelle celle piene.
- Le Statistiche mostrano la copertura media nell'area selezionata (o nell'area totale se non specificata).
- Clicca "Show Depth" per alternare la visualizzazione tra Copertura e Profondità.
- Clicca "Calculate Density" per calcolare la densità (punti/m²) nell'area selezionata.
- La prima mappa mostra la percentuale di copertura (overlap).
- Esportazione:
- Clicca "Export JPEG+Jgw" per scaricare un'immagine
della vista corrente (
.jpg) e il suo file di georeferenziazione (.jgw).
- Clicca "Export JPEG+Jgw" per scaricare un'immagine
della vista corrente (
Requisiti File DXF
Importante:
- Il file DXF deve contenere una singola Polilinea 2D (Polyline).
- La polilinea deve essere chiusa.
- Il file deve essere salvato in formato AutoCAD R12 DXF. Formati più recenti potrebbero non essere letti correttamente.